the accumulation of small risks

a simple plot that informs how i make decisions

Author
Published

December 12, 2023

When we take small risks repeatedly, that risk accumulates, and it can accumulate surprisingly quickly.

I find myself referring back to this figure on a regular basis.

Line chart titled 'Risks accumulating with repetition' showing ten curves for annual event probabilities from 1 percent to 10 percent. The x-axis shows years 1 to 50 and the y-axis shows the probability of at least one event occurring from 0 to 100 percent. Even a 1 percent annual risk reaches roughly 40 percent over 50 years; a 10 percent annual risk exceeds 99 percent within 50 years.

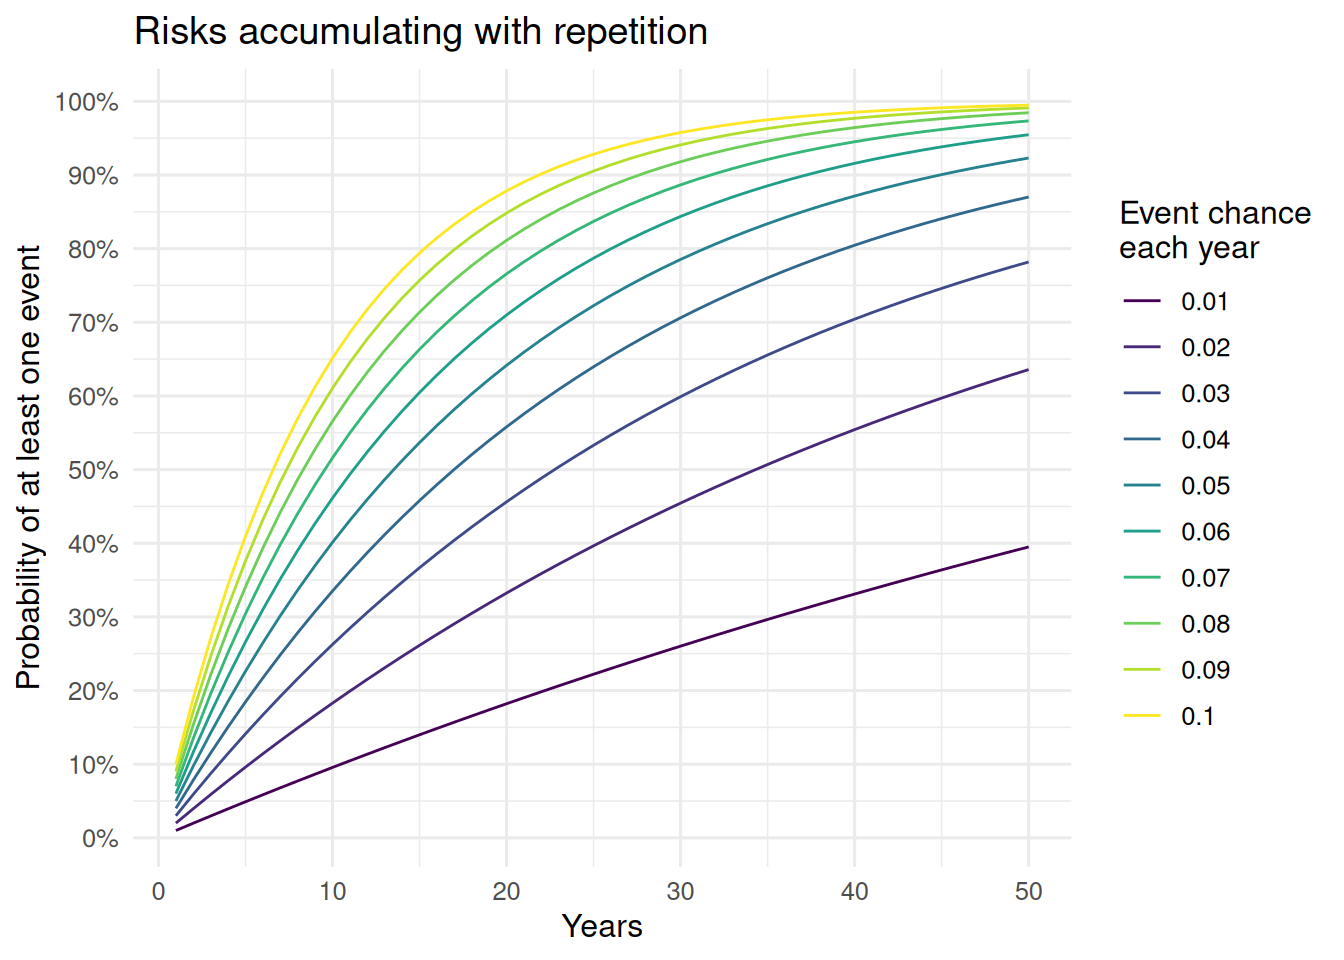
If you want to toy around with the numbers and make your own figure, you should be able to do that by changing the values in the p_event and time variables below and then hitting the Run Code button.